J-Debugr
Features
|
• 100% Free under GPL v3 (including source code)
• Graphical view and manipulation of ALL registers • Graphical Tab per Peripheral Card & Motherboard • Read/Write registers word wide or bit wide • Monitors register read/writes from Ethernet & JTAG • Registers colours by last action/command source (customisation) • Logging of all reads/writes in order of occurrence • Logging time stamps • Customisation register names for application specific naming • Log colour-coded by action and command source (customisation) • Acts extremely similar to MCU debug environment • Developed using Qt cross-platform framework |
About
The J-Debugr software is a truly versatile ‘Free’ debug environment for the J-Testr Core systems. It provides a graphical user interface to
issue read and write commands to the J-Testr Core internal registers in real-time. This means that even if the J-Testr Core is executing
commands from the test software, the operator can instantly read, or even overwrite, the values that have been written from the test
software. When working in conjunction with the test system software's run, break, stop, and step debugging features, the user can
read the state of J-Testr Core registers to confirm that they are as expected, and if not, change them to the value required.
The J-Debugr software is a truly versatile ‘Free’ debug environment for the J-Testr Core system. It provides a graphical user interface to
issue read and write commands to the J-Testr Core internal registers in real-time. This means that even if the J-Testr Core is executing
commands from the test software, the operator can instantly read, or even overwrite, the values that have been written from the test
software. When working in conjunction with the test system software's run, break, stop, and step debugging features, the user can
read the state of J-Testr Core registers to confirm that they are as expected, and if not, change them to the value required.
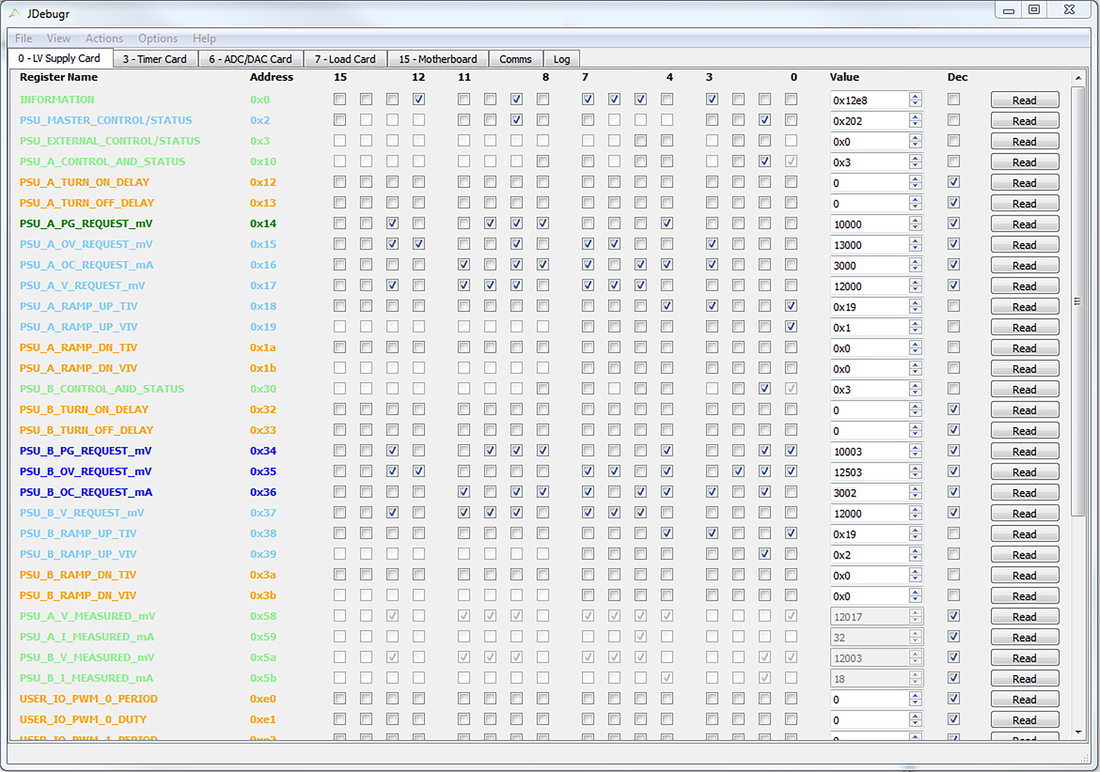
To make debugging even easier, each register is colour coded, as per below, to indicate what the last action for that particular register was:
None > Orange (All, or individual, peripherals/motherboard can be reset back to ‘None’ at any point.)
JDebugr Read > Dark Green
JDebugr Write > Dark Blue
Test SW* Read > light Green
Test SW* Write > light Blue
Note - Since version 1.1.0 colours are customisation
* The Test software (SW) can be either a Ethernet based communications platform or an JTAG based communications platform.
issue read and write commands to the J-Testr Core internal registers in real-time. This means that even if the J-Testr Core is executing
commands from the test software, the operator can instantly read, or even overwrite, the values that have been written from the test
software. When working in conjunction with the test system software's run, break, stop, and step debugging features, the user can
read the state of J-Testr Core registers to confirm that they are as expected, and if not, change them to the value required.
The J-Debugr software is a truly versatile ‘Free’ debug environment for the J-Testr Core system. It provides a graphical user interface to
issue read and write commands to the J-Testr Core internal registers in real-time. This means that even if the J-Testr Core is executing
commands from the test software, the operator can instantly read, or even overwrite, the values that have been written from the test
software. When working in conjunction with the test system software's run, break, stop, and step debugging features, the user can
read the state of J-Testr Core registers to confirm that they are as expected, and if not, change them to the value required.
To make debugging even easier, each register is colour coded, as per below, to indicate what the last action for that particular register was:
None > Orange (All, or individual, peripherals/motherboard can be reset back to ‘None’ at any point.)
JDebugr Read > Dark Green
JDebugr Write > Dark Blue
Test SW* Read > light Green
Test SW* Write > light Blue
Note - Since version 1.1.0 colours are customisation
* The Test software (SW) can be either a Ethernet based communications platform or an JTAG based communications platform.
|
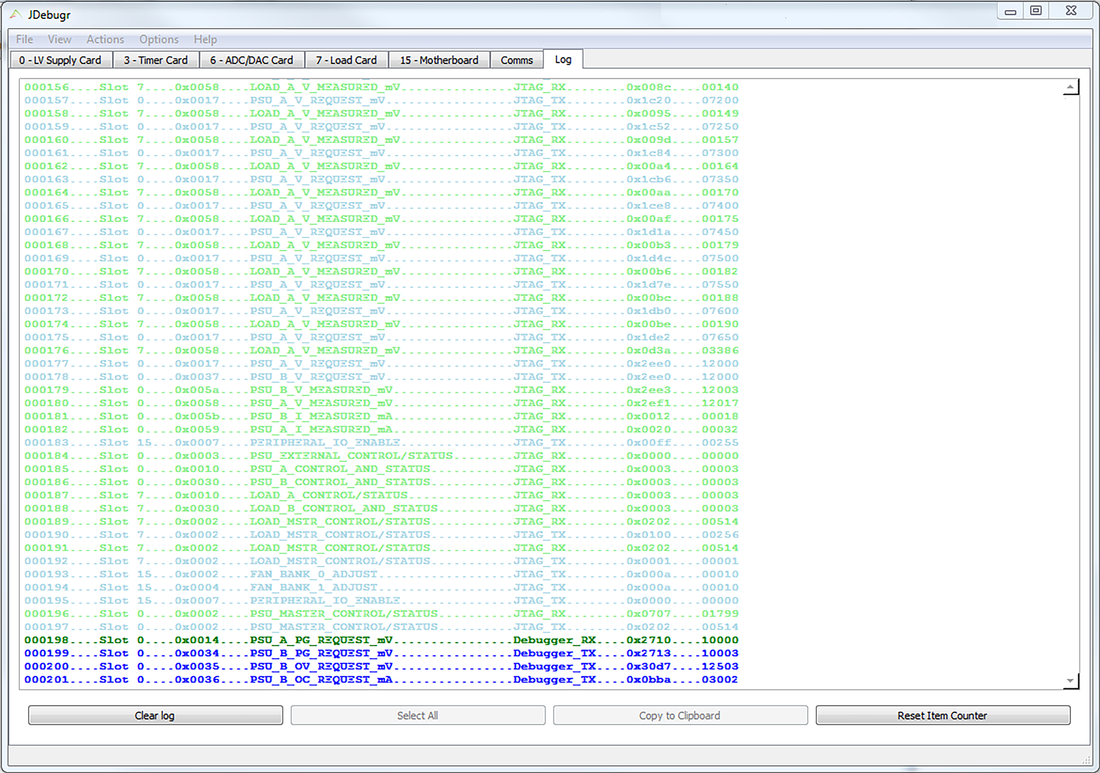
To assist debugging even further, the J-Debugr includes a logger tab that shows all the register reads and writes that have occurred since the last time the log was cleared. Each line of the log is colour coded in the same manner as the register read/write GUI functionality, and contains the following information:
ID Code, Peripheral Slot, Register address, Register name, Action Source, Hex Value, Decimal Value and Time Stamp All these J-Debugr features are extremely similar to standard micro-controller / micro-processor debugger environments, and have been designed to be simple and uncomplicated to use. Hence, when coupled with J-Testr’s Core register based communications, J-Debugr will make all engineers with any basic knowledge of micro-controller / micro-processor programming instantly at home. |
This familiar control interface, debugging environment, and general development work flow, means companies can save significant
time and money on training and test development.
time and money on training and test development.


